Tencent recently published their financial statement in the second quarter. According to the report, the revenue from online game business accounted for more 50% of the total.
Online Ads revenue (Blue) 879.7 million RMB (8.3%)
Online Game revenue (Yellow) 5564.7 million RMB (52.9%)
Community or Open Platform revenue(Green) 2221.9 million RMB (21.1%)
Mobile or Telecom value-added service(red) 929.0 million RMB (8.8%)
EC business revenue (Purple) 857.5 million RMB (8.1%)
Other revenue 74.4 million RMB (0.8%)
I reported before the comparison infographic of Tencent and Facebook, the most interesting thing is comparison of its revenue percentage. Because the recent revenue of Facebook was accounted for 84% from Ads on their service.
Recently Tencent has a bigger market capitalization than Facebook Inc, but I'm interested that which company have bigger chance in the future.
Source => Eguan
Writing about Social Media (SNS, WeChat, Weibo, LBS, Enterprise Social Networking and so on) and Mobile market/industry activity and their service in China and around Asia.
Thursday, August 23, 2012
Monday, August 20, 2012
Taobao formally released their IM tool "WangXin".
Today, Taobao formally released their IM tool "WangXin".
At the moment, it seems that they provide its Android and iPhone client.
And its main functions are as follows:
User can get the news from Taobao.
Voice Chat feature
Friend search feature based LBS.
Taobao said that they estimate its user will be 15 million people at the end of 2012, but is it possible? Actually, from the perspective of IM function, the function of WangXin is inferior to WeChat(Tencent) or Meyou(Sina). But from the perspective of the cooperation tool of mobile shopping on Taobao, they may have the possibility of success, because Taobao already have 100 million mobile users, and it is estimated to exceed 200 million people at the end of 2012.
We have to continue watching their action as ever, and also have to watch that other internet giants, such as Baidu or Sohu, will follow this trend or not.
Source => TechWeb
At the moment, it seems that they provide its Android and iPhone client.
And its main functions are as follows:
User can get the news from Taobao.
Voice Chat feature
Friend search feature based LBS.
Taobao said that they estimate its user will be 15 million people at the end of 2012, but is it possible? Actually, from the perspective of IM function, the function of WangXin is inferior to WeChat(Tencent) or Meyou(Sina). But from the perspective of the cooperation tool of mobile shopping on Taobao, they may have the possibility of success, because Taobao already have 100 million mobile users, and it is estimated to exceed 200 million people at the end of 2012.
We have to continue watching their action as ever, and also have to watch that other internet giants, such as Baidu or Sohu, will follow this trend or not.
Source => TechWeb
Saturday, August 18, 2012
Sina Weibo already started monetization, and their ads revenue was 10 million USD in the second quarter.
Sina published their statement in the second quarter, and this statement said that whole ads revenue of Sina company was 103.1 million USD.
In this ads revenue, ads revenue of Sina Weibo was 10 million USD in the same period. And Sina also said that its ads revenue consist 75 to 80% of existing customer and around 20% of new customer.
In this way, they started monetization, but Sina CEO Charles Chao said that Sina Weibo will start the promotional tweet in the fourth quarter and accelerate the action of their virtual money "Weibi" .
They also said that Sina Weibo already have 368 million users in the same period, and its daily active users were 36.5 million people. And the ratio of their mobile access was 69%, but 20% of this user also use PC for accessing to Sina Weibo, so it can be said the ratio of using only mobile was around 40%.
As I reported before, China's internet industry also rapidly increasing mobile internet user, so it can be said that the challenge of Sina Weibo is accelerating mobile solution in addition to promotional tweet and virtual money.
Source => Sohu IT, SCOL
In this ads revenue, ads revenue of Sina Weibo was 10 million USD in the same period. And Sina also said that its ads revenue consist 75 to 80% of existing customer and around 20% of new customer.
In this way, they started monetization, but Sina CEO Charles Chao said that Sina Weibo will start the promotional tweet in the fourth quarter and accelerate the action of their virtual money "Weibi" .
They also said that Sina Weibo already have 368 million users in the same period, and its daily active users were 36.5 million people. And the ratio of their mobile access was 69%, but 20% of this user also use PC for accessing to Sina Weibo, so it can be said the ratio of using only mobile was around 40%.
As I reported before, China's internet industry also rapidly increasing mobile internet user, so it can be said that the challenge of Sina Weibo is accelerating mobile solution in addition to promotional tweet and virtual money.
Source => Sohu IT, SCOL
Tuesday, August 14, 2012
The rate of iPad tablet user is six times more than Android tablet user in China.
UMENG, who provide mobile apps analytic tools, published the report that is written about Android and iOS active users status.
According this report, in China, Android active user increased 87%, and iOS active user increased 42% in the second quarter.
And the ratio of mobile and tablet in each platform is as follows.
The ratio of iOS was 80.8% iPhone and 19.2% iPad, and the ratio of Android was 96.5 % mobile and 3.5% tablets. It also said that the ratio of iOS tablet is six times more than Android tablet.
Next is the ratio of each iPhone devices.
The ratio of iPhone 4S is gradually increasing, on the other hand the ratio of iPhone 4 is gradually decreasing. (But it still have over 50% share.)
Next is the ratio of each iPad devices.
The ratio of New iPad is rapidly growing, but the ratio of iPad 2(Wifi+3G) is totally 73.4%.
And next graph is the ratio transition of iOS version in the first half year.

iOS 5.1 was rapidly increasing, and it became the top share in the each version of iOS on April.
Next graph is the share of each Android device maker in the end of June.
#1 Samsung 23.8%
#2 HTC 18.5%
#3 Motolora 8.0%
#4 ZTE 7.4%
#5 Huawei 6.5%
The other 35.7%
Samsung is the top share in Android device makers, and they dominate a quarter of this market in China. But "the other" also have 35.7% share(mainly domestic device maker), so it also can be said that this market is still the status of rival warlords.
And next graph is the ranking of each Android devices.
#1 Samsung Galaxy Ace 4.11%
#2 Motorola Defy 3.12%
#3 Xiaomi M1 3.11%
#4 HTC Incredible S 2.62%
#5 Samsung Galaxy SII 2.60%
#6 HTC Desire S 2.08%
#7 ZTE Blade U880 1.92%
#8 ZTE Blade V880 1.73%
#9 Huawei C8650 1.55%
#10 HTC Desire HD 1.35%
And the last graph is the ratio transition of each Android version in the first half year.
Basically Android 2.3 have around 70% share, and its rate of change is stable too. And Android 4.0 also started to increase gradually from May, but its share was still less than 10% in the end of June.
It looks like that China's mobile market still continue to be expanded with a focus on Android and iOS, but it also looks like that there are various changes.
Souce => UMENG
According this report, in China, Android active user increased 87%, and iOS active user increased 42% in the second quarter.
And the ratio of mobile and tablet in each platform is as follows.
The ratio of iOS was 80.8% iPhone and 19.2% iPad, and the ratio of Android was 96.5 % mobile and 3.5% tablets. It also said that the ratio of iOS tablet is six times more than Android tablet.
Next is the ratio of each iPhone devices.
The ratio of iPhone 4S is gradually increasing, on the other hand the ratio of iPhone 4 is gradually decreasing. (But it still have over 50% share.)
Next is the ratio of each iPad devices.
The ratio of New iPad is rapidly growing, but the ratio of iPad 2(Wifi+3G) is totally 73.4%.
And next graph is the ratio transition of iOS version in the first half year.

iOS 5.1 was rapidly increasing, and it became the top share in the each version of iOS on April.
Next graph is the share of each Android device maker in the end of June.
#1 Samsung 23.8%
#2 HTC 18.5%
#3 Motolora 8.0%
#4 ZTE 7.4%
#5 Huawei 6.5%
The other 35.7%
Samsung is the top share in Android device makers, and they dominate a quarter of this market in China. But "the other" also have 35.7% share(mainly domestic device maker), so it also can be said that this market is still the status of rival warlords.
And next graph is the ranking of each Android devices.
#1 Samsung Galaxy Ace 4.11%
#2 Motorola Defy 3.12%
#3 Xiaomi M1 3.11%
#4 HTC Incredible S 2.62%
#5 Samsung Galaxy SII 2.60%
#6 HTC Desire S 2.08%
#7 ZTE Blade U880 1.92%
#8 ZTE Blade V880 1.73%
#9 Huawei C8650 1.55%
#10 HTC Desire HD 1.35%
And the last graph is the ratio transition of each Android version in the first half year.
Basically Android 2.3 have around 70% share, and its rate of change is stable too. And Android 4.0 also started to increase gradually from May, but its share was still less than 10% in the end of June.
It looks like that China's mobile market still continue to be expanded with a focus on Android and iOS, but it also looks like that there are various changes.
Souce => UMENG
Labels:
Android,
China,
iOS,
iPad,
iPhone,
market report,
market research,
market share,
mobile,
smartphone
Thursday, August 9, 2012
Over 150 billion pictures were already registered on Qzone. [INFOGRAPHIC]
Qzone published an infographic that is written about pictures on their service.
On Qzone was already registered over 150 billion pictures.
Average 200 million pictures are registered on Qzone per a day, and 360 million pictures were registered at the maximum in a day. According to the Mashable article, on Facebook is registered about 300 million pictures per a day, so it can be said that there are not so much difference between them.
The ratio of male to female is 48% and 52%.
About the ratio of age, the range of 21 to 30 years old are the biggest ratio.
40% of user published their pictures to everyone, and 24% of users published their pictures to only them selves, and 23% of user set the QA to access those picture, and 13% of users published their pictures to only their friends.
53% of users registered their pictures from mobile, and 25% of users use the digital camera, and 22% of users use a single‐lens reflex camera.
But about the number of pictures per a user, the average of using digital camera user is the largest, it is 23.5 pictures per a user.
I reported before about "Tencent v.s. Facebook", as far as I can see it and this infographic, it still can be said that there is not so much difference between them :)
Source => TechWeb
On Qzone was already registered over 150 billion pictures.
Average 200 million pictures are registered on Qzone per a day, and 360 million pictures were registered at the maximum in a day. According to the Mashable article, on Facebook is registered about 300 million pictures per a day, so it can be said that there are not so much difference between them.
The ratio of male to female is 48% and 52%.
About the ratio of age, the range of 21 to 30 years old are the biggest ratio.
40% of user published their pictures to everyone, and 24% of users published their pictures to only them selves, and 23% of user set the QA to access those picture, and 13% of users published their pictures to only their friends.
53% of users registered their pictures from mobile, and 25% of users use the digital camera, and 22% of users use a single‐lens reflex camera.
But about the number of pictures per a user, the average of using digital camera user is the largest, it is 23.5 pictures per a user.
I reported before about "Tencent v.s. Facebook", as far as I can see it and this infographic, it still can be said that there is not so much difference between them :)
Source => TechWeb
Labels:
Facebook,
market report,
market research,
QQ,
Qzone,
Tencent
Wednesday, August 8, 2012
Chinese listed internet company analysis report
Recently, iResearch consulting group published "Chinese listed internet company analysis report".
First, this is a distribution map of those company headquarters location.
Beijing : 22 companies (52.3%)
Shanghai : 11 companies (27.3%)
Hangzhou : 2 companies (4.5%)
Guangzhou : 2 companies (4.5%)
Shenzhen : 2 companies (4.5%)
Hongkong : 2 companies (4.5%)
Fuzhou : 1 company (2.3%)
Next is the establishment year of each companies.
These are summary of it.
1988 Kingsoft(*1)
1997 NetEase
1998 Sina, Tencent, Sohu
1999 Alibaba, SNDA
2001 Baidu(*2)
2004 Giant
2005 Renren, Tudou, 360
2006 Youku
*1 According to their homepage, establishment year was 1989.
*2 According to their homepage, establishment year was 2000.
Next graph is their listed market.
Nasdaq 52.3%
NYSE 22.7%
HKEx 18.4%
SSE 2.3%
SZSE 4.5%
Next graph is the listed year of each companies.
These are summary of it.
2000 Sina, Sohu, NetEase
2004 Tencent, SNDA
2005 Baidu
2007 Giant, Kingsoft, Alibaba
2010 Youku
2011 Tudou, 360, Renren
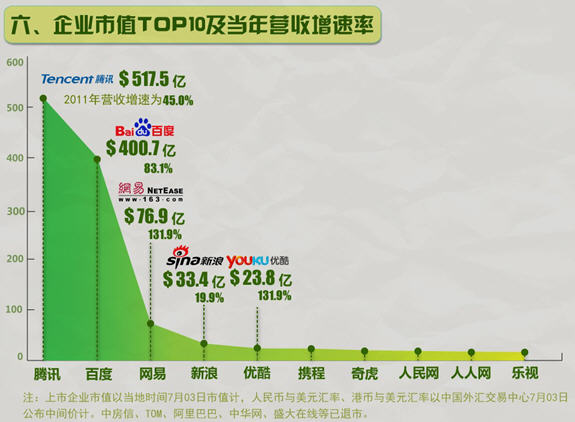
Last is a graph of their market cap and sales growth rate.
Tencent : 51.75 billion RMB (sales growth rate 45.0%)
Baidu : 40.07 billion RMB (sales growth rate 83.1%)
NetEase : 7.69 billion RMB (sales growth rate 131.9%)
Sina : 3.34 billion RMB (sales growth rate 19.9%)
Youku : 2.38 billion RMB (sales growth rate 131.9%)
* Alibaba, SNDA, TOM, CRIC and china.com were already delisting.
Source => 91.com
First, this is a distribution map of those company headquarters location.
Beijing : 22 companies (52.3%)
Shanghai : 11 companies (27.3%)
Hangzhou : 2 companies (4.5%)
Guangzhou : 2 companies (4.5%)
Shenzhen : 2 companies (4.5%)
Hongkong : 2 companies (4.5%)
Fuzhou : 1 company (2.3%)
Next is the establishment year of each companies.
These are summary of it.
1988 Kingsoft(*1)
1997 NetEase
1998 Sina, Tencent, Sohu
1999 Alibaba, SNDA
2001 Baidu(*2)
2004 Giant
2005 Renren, Tudou, 360
2006 Youku
*1 According to their homepage, establishment year was 1989.
*2 According to their homepage, establishment year was 2000.
Next graph is their listed market.
Nasdaq 52.3%
NYSE 22.7%
HKEx 18.4%
SSE 2.3%
SZSE 4.5%
Next graph is the listed year of each companies.
These are summary of it.
2000 Sina, Sohu, NetEase
2004 Tencent, SNDA
2005 Baidu
2007 Giant, Kingsoft, Alibaba
2010 Youku
2011 Tudou, 360, Renren
Last is a graph of their market cap and sales growth rate.
Tencent : 51.75 billion RMB (sales growth rate 45.0%)
Baidu : 40.07 billion RMB (sales growth rate 83.1%)
NetEase : 7.69 billion RMB (sales growth rate 131.9%)
Sina : 3.34 billion RMB (sales growth rate 19.9%)
Youku : 2.38 billion RMB (sales growth rate 131.9%)
* Alibaba, SNDA, TOM, CRIC and china.com were already delisting.
Source => 91.com
Monday, August 6, 2012
Apple dominate about three-quarters of China's tablets market.
According to the report by Eguan, the sales scale of tablets in China was 2,340,000 units in the second quarter.
It was increasing 7.8% compared to the previous quarter, and increasing 64% compared to the previous year.
According to the report by Gartner, the worldwide tablets sales reach 119 million units in 2012. And Eguan estimated that tablets sales in China will be over 10 million in 2012, so it can be said that one of ten tablets are sold in China.
Next is the market share of each tablets maker.
#1 Apple 72.66%
#2 Lenovo 8.38%
#3 Eben 3.63%
#4 Samsung 3.59%
#5 Acer 3.27%
#6 Asus 1.86%
#7 Teclast 0.98%
#8 Ramos 0.62%
#9 Aigo 0.33%
#10 Motorola 0.26%
Other 4.42%
The market share of Apple was 65.21% in the previous period, so its market share increased 7.45%.
And except Apple, all of them providing tablets is Android based, so it can be said that Chinese market is in the status of "iPad v.s. Android".
It seems that many chances in this market will continue as ever in this year, doesn't it? :)
Source : Eguan-1, Eguan-2
It was increasing 7.8% compared to the previous quarter, and increasing 64% compared to the previous year.
According to the report by Gartner, the worldwide tablets sales reach 119 million units in 2012. And Eguan estimated that tablets sales in China will be over 10 million in 2012, so it can be said that one of ten tablets are sold in China.
Next is the market share of each tablets maker.
#1 Apple 72.66%
#2 Lenovo 8.38%
#3 Eben 3.63%
#4 Samsung 3.59%
#5 Acer 3.27%
#6 Asus 1.86%
#7 Teclast 0.98%
#8 Ramos 0.62%
#9 Aigo 0.33%
#10 Motorola 0.26%
Other 4.42%
The market share of Apple was 65.21% in the previous period, so its market share increased 7.45%.
And except Apple, all of them providing tablets is Android based, so it can be said that Chinese market is in the status of "iPad v.s. Android".
It seems that many chances in this market will continue as ever in this year, doesn't it? :)
Source : Eguan-1, Eguan-2
Labels:
Android,
China,
Gartner,
iPad,
market report,
market research,
tablet
Subscribe to:
Posts (Atom)